3 ways to know used memory
What task I would like to solve
Recently, I was trying to find out how much memory an application uses during a particular operation. The operation I want to measure is the creation of data snapshots. The application stores a sequence of operations on objects and periodically creates object snapshots. So if we want to know the object’s state at a given point in time, we don’t replay all the operations from the beginning to that point. We get the object’s state from the closest snapshot and replay only a limited number of operations from that snapshot to our point in time.
Obviously, we would like to store as many recent snapshots as possible in a heap, but in the real world, we have limited memory. We should limit the amount of memory for snapshots, and we traditionally do this by setting the threshold in the application properties.
The next step is to provide some meaningful defaults for this property. The problem is that we cannot predict the value because different customers have different environments, data, snapshot sizes, etc. This means we need more data to make a decision.
Finally, we decided to log how much heap was used before and after the snapshot was taken and ended up with something like this:
public Snapshot buildSnapshot() {
	long usedMemory = calculateUsedMemory();
	try {
		return doBuildSnapshot();
	} finally {
		log.debug("Used memory: " + (calculateUsedMemory() - usedMemory));
	}
}
java.lang.Runtime way
If you google “java used memory in runtime” you will see this method: Runtime.getRuntime().totalMemory() - Runtime.getRuntime().freeMemory() and several variations of it.
Let’s have a closer look at what this method returns.
For total memory:
Returns the total amount of memory in the Java Virtual Machine. The value returned by this method may vary over time depending on the host environment.
For free memory:
Returns the amount of free memory in the Java Virtual Machine. Calling the gc method may result in an increase in the value returned by freeMemory.
In other words, the total memory may contain references to no longer-needed objects. The object will be freed after garbage collection, but we have no control over GC and don’t know when it will be executed.
So we have to find something better.
JMX way
JMX is stated from Java Management Extensions. We may use these built-in extensions to get different information about Runtime internals.
In java.lang.management.ManagementFactory, we may find a lot of factory methods for any task we like, but we are most interested in MemoryMXBean getMemoryMXBean().
The method returns a manageble bean we can use to request heap memory usage.
private static final MemoryMXBean MEMORY_MX_BEAN = ManagementFactory.getMemoryMXBean();

private long calculateUsedMemory() {
	return  MEMORY_MX_BEAN.getHeapMemoryUsage().getUsed();
}
So far, good, but the methods above show only used memory at some specific time for the whole application, and we still need to find out how much memory the application waste on storing the snapshot.
Let’s look at the task from another point, how much memory we used to complete the operation.
In other words, how effective is the code from a memory usage perspective? Knowing this and GC information, we could predict the default value.
Secret JMX way
JMX has two ThreadMXBean interfaces, java.lang.management.ThreadMXBean and com.sun.management.ThreadMXBean.
Both could be used to get information about threads.
The first one is public and returned by ManagementFactory, but it does not have any memory-related methods.
The second one declares 2 excellent methods:
long getThreadAllocatedBytes(long id)- Returns an approximation of the total amount of memory, in bytes, allocated in heap memory for each thread whose ID is in the input array ids.long getCurrentThreadAllocatedBytes()- Returns an approximation of the total amount of memory, in bytes, allocated in heap memory for the current thread. More thancom.sun.management.ThreadMXBeanextendsjava.lang.management.ThreadMXBean, so we can use the interface instead of the first one.
But you will not find any methods returning these interfaces.
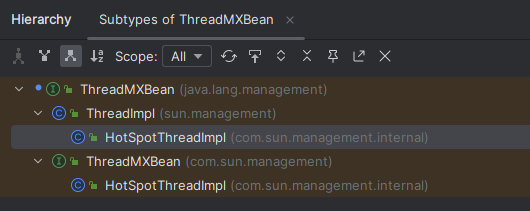
If will look at ThreadMXBean hierarchy, I may see that, in my JDK, both interfaces are implemented by a single class.

I’ve used Amazon Correto 11, but the same picture in other JDKs (checked on Eclipse Temurin and Azul).
Now my code may look like this:
private final LongSupplier allocatedByThread = initAllocatedMemoryProvider();

private static LongSupplier initAllocatedMemoryProvider() {

    ThreadMXBean threadMXBean = ManagementFactory.getThreadMXBean();
    if (threadMXBean instanceof com.sun.management.ThreadMXBean) {
        com.sun.management.ThreadMXBean casted = (com.sun.management.ThreadMXBean) threadMXBean;
        return casted::getCurrentThreadAllocatedBytes;
    }
    return () -> 0;
}

private long calculateUsedMemory() {
	return initAllocatedMemoryProvider().getAsLong();
}
The issue is only that com.sun.management.ThreadMXBean in jdk.management module, so if a customer runs our application with JRE we will not have the interface in the classpath. The application will crush with NoClassDefFoundError, but we may fix it with Reflection API.
private static LongSupplier initAllocatedMemoryProvider() {
	try {
	    Class<?> internalIntf = Class.forName("com.sun.management.ThreadMXBean");
	    ThreadMXBean bean = ManagementFactory.getThreadMXBean();
	    if (!internalIntf.isAssignableFrom(bean.getClass())) {
            // Attempts to get the interface from PlatformMXBean
	        Class<?> pmo = Class.forName("java.lang.management.PlatformManagedObject");
	        Method m = ManagementFactory.class.getMethod("getPlatformMXBean", Class.class, pmo);
	        bean = (ThreadMXBean) m.invoke(null, internalIntf);
	        if (bean == null) {
	            throw new UnsupportedOperationException("No way to access private ThreadMXBean");
	        }
	    }

	    ThreadMXBean allocMxBean = bean;
	    Method allocMxBeanGetter = internalIntf.getMethod("getCurrentThreadAllocatedBytes");

	    return () -> (long)allocMxBeanGetter.invoke(allocMxBean);
	} catch (Exception e) {
	    return () -> 0;
	}
}
Conclusion
You may get access to different runtime information with JMX, but you may find a treasure if you dig slightly deeper.
You may find the code on GitHub.
